
For the past two seasons, I have had the pleasure to be the defensive line coach and special teams coordinator at J.H. Rose High School. Before I came to Rose, I coached at my alma matter North Pitt for five years and became the interim Head Coach in 2017. Let’s just say going from a 2A high school like North Pitt, to a 3A/4A school such as Rose, was quite the football culture shock. Schools only separated by the Tar River and 12.5 miles, yet they are worlds apart in facilities, culture, manpower, coaches, community, you name it. When I was at North Pitt I had 31 players on the entire team, and when I came to Rose I had 16 players just on the defensive line.
While at North Pitt I coached on the offensive side of the ball and coming to Rose I switched to defense. The last time I worked with a defense is when I scripted play calls for Greg Hudson and Brian Mitchell at East Carolina, 7 years ago. While I was the interim head coach at North Pitt, I didn’t have the time or manpower to try the concepts I wanted. Anyone who has taken on the role of head coach can attribute that you never do have enough time for what all you want to do. However, when I came to Rose I now had the time to implement strategies learned that I never had time to before. One of those being grading film and creating performance charts for my position players and special teams players.
Everyone knows in the coaching circles that when you hear Rose football these past few years, you don’t think of defense first. It’s hard to think defense when you had players like Cornell Powell and others who were offensive powerhouses under Coach Wojtecki’s Power Raid offenses. The season before I arrived at Rose, Rose went 3-8 and the defense averaged giving up 44.27 points per game (PPG) in 2017. In 2018, the defensive coordinator and staff decided to switch from a 3-4 to a 4-2-5 multiple defense. The scheme change absolutely fit our personnel better and helped us improve to 8-4 in the 2018 season and cut the average defensive PPG to 18.54, the lowest since 2013 and the next best mark being 2008. We graduated alot of seniors in 2018 on the defensive line and our average PPG went up to 25.73 in 2019. However, our defensive line made 33% of all the tackles that season and held up the offensive line to allow our MLB to make 142 tackles on the season.
The statistics I mention are not the best ever or even mind staggering when you compare them to the likes of schools like Tarboro or Havelock, but they do show a vast improvement over time. Going from 44.27 PPG to 18.54 in one season when you play mostly spread teams is an accomplishment. My point in the previous is to show how grading film and posting performance charts improved the play of the defensive line and their effort during the game.
Performance Chart:
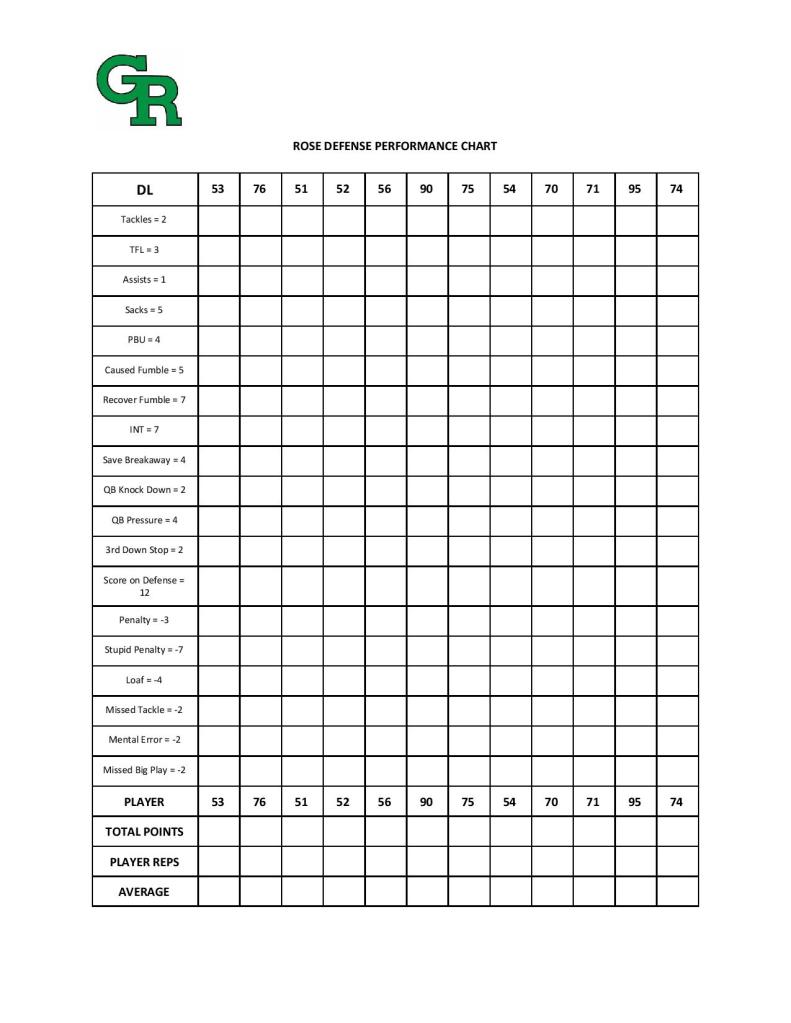
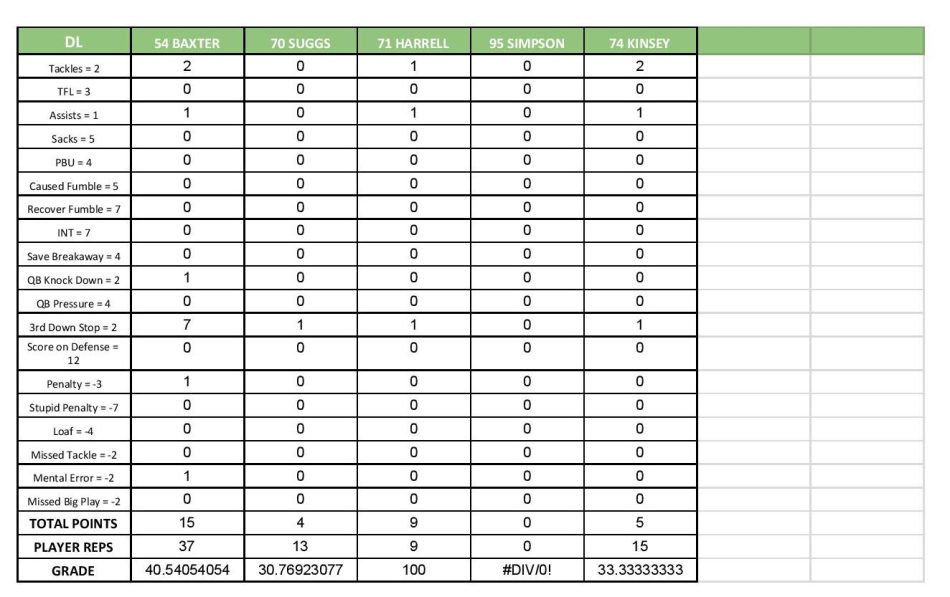
The image above shows the performance chart I used to grade players while watching film. It incorporates everything from tackles to loafs, and stupid penalties. Every category has an assigned value. For example, a tackle will get you 2 points, a sack will get you 5 points, and a stupid penalty will get you -7 points. Of course, the point value system can be changed to whatever you chose but so far these point awards have seemed to be the best.
How does it work:
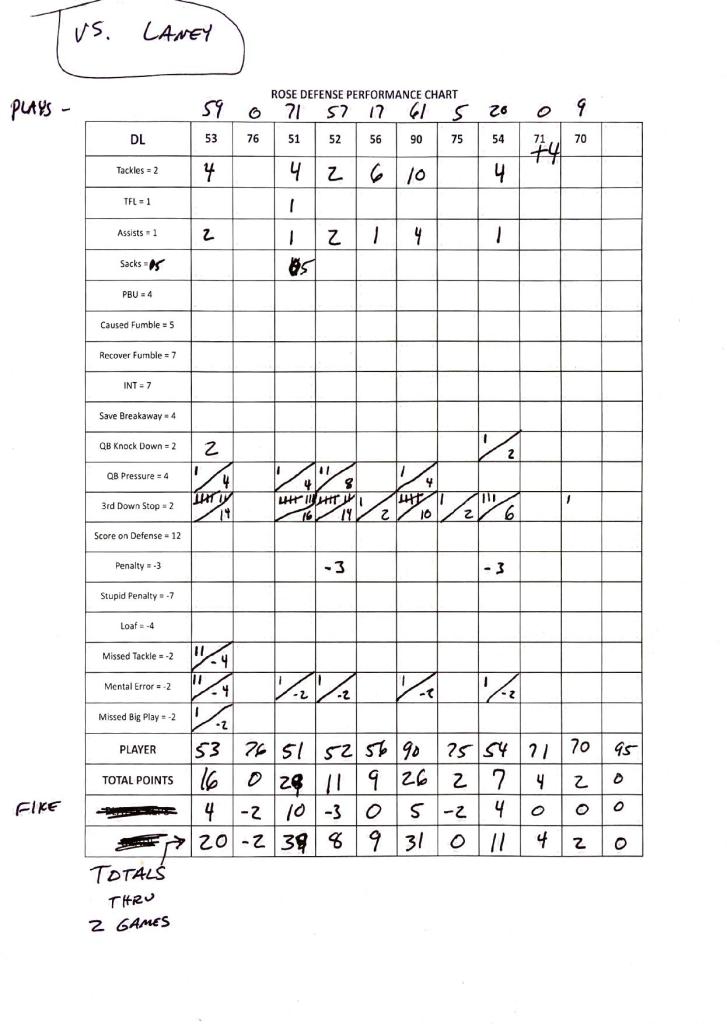
Simply put, you watch film and watch every play four times. When I first started doing this I know I watched film for three hours of the previous game. But after you get the hang of it you can slow down the play in Hudl and get efficient with the grading. By the end of the season, I was down to about an hour. While watching the film you put tick marks in each box where one of your players makes a play or doesn’t. At the top of the page in the “DL” row, are the player’s numbers. At the bottom of the page is how many points a player got that game. For example, if a player got 3 tackles, that would equal 6 points for that game. Below is a completed grade sheet after our game vs. Laney.
Pros of the Performance Chart:
- Hustle: At first the players didn’t know what to expect when I said I was going to grade them and have a year-long competition. Before our first jamboree at Tarboro, I told the DL they would be graded and everything they did will be analyzed and they would be held accountable. After the Tarboro scrimmage, we had about 11 loafs. A loaf to me is not that you mess up or are out of position. A loaf is when you give up and do not run to the ball. Let’s just say after running 11 gassers as a unit the next week at practice, we got rid of most of the loafs. Whether you run to the ball in the game or the next week at practice, you will run at some point. Might as well be during the game.
- Competition: The performance chart created competition on the defensive line. After seeing grades the players wanted to know how they could get better and improve their grade. The best thing about it, it’s that it’s right there on the chart. You get better by doing your job. Do your job and the points will come.
- Accountability: The old saying is still true, “The eye in the sky doesn’t lie.” Especially after the first couple of games and the players know that you are watching their every move.
- Excitement: On Mondays when we came to school all I could hear from the defensive lineman was “What was my grade?” I know this could be counter-intuitive when it comes to team goals but it was exciting to have the players care about their performance. As long as you keep them roped in, I think it’s great.
- Other Players Were Jealous: Other players on the defense actually became jealous and wanted to know why their position coaches were not grading them. I think it created healthy competition.
- You Actually Watch Film: I actually started watching film with a purpose. Grading the players helped me pick up on small tendencies that I would otherwise have looked over if I was just watching the “big picture.” I would pick up on tendencies of my players and could tell when they were about to mess up. Also, I started noticing the small intricacies of the opposing team’s offensive lineman. My defensive ends learned how to “read” the foot of an offensive lineman and immediately react to the play of off his movement.
Cons of the Performance Chart:
- Time: As I mentioned before, it took up a lot of time in the beginning, but by the end of the season it didn’t take as long. I will say that spending that time and doing it made me a better coach, and I could answer the questions my players had without hesitation.
- Unhealthy Competition: At one point during the season players started to complete for themselves and not the team because they wanted to increase their tackle total or whatever else. This only came up once after we lost three games in a row. To fix this I simply stopped telling them their grades. When they started to become humble again and a team player, I was able to release the grades again.
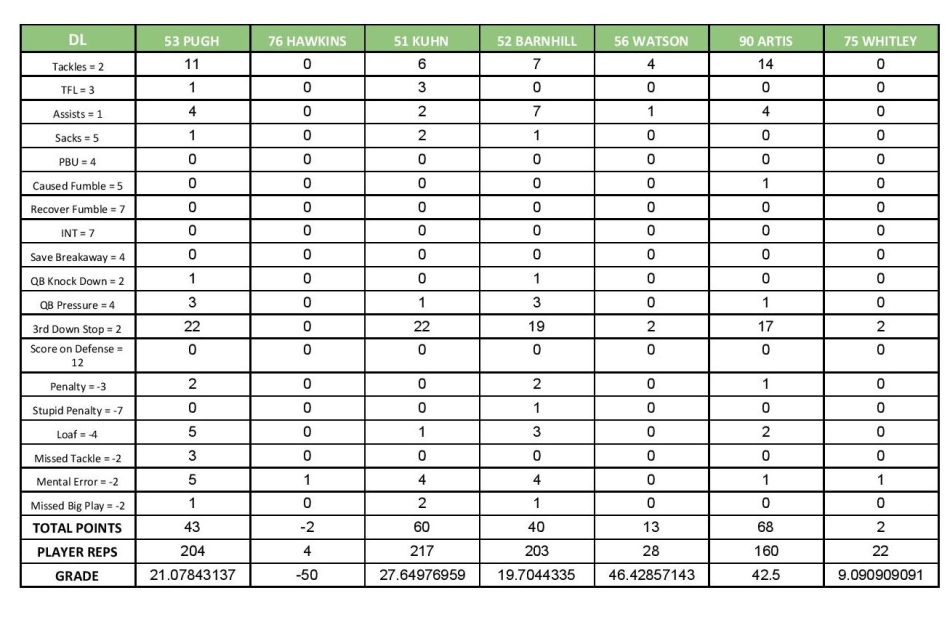
- Some Feel Left Out: The players who did not see the field as much as the other players felt left out. As you can tell by the end of the season chart, some players do not play as much as others and their point totals reflect that. If a player feels they can’t catch up in points, then they feel like quitting.
Future Changes:
- Bonus Points: What I need to add in the chart are bonus points for other categories. For example, my starting DT (who is a great player) was told to take up double teams to keep the OL off of the MLB. He did his job and the MLB had 142 tackles. However, this does not help his stat sheet or grade numbers at all. I will need to create a “Did Your Job” category for those instances.
- Break Points: Having a DL that is 16 deep does not tend to let all of those players play. I had 4 rotating units at any time during a game, with obviously the starters playing the most. From now on to make sure the competition is fair, I need to create breakpoints based on the number of plays. So if you are in group 1, more than likely you are a starter and you are well above the plays a player in the third tier would have. Essentially flight it just like a golf tournament but based on the number of plays.
- Only Counts When You Win: After last season I am thinking that maybe the grades should only count if you win. It seems unfair if a player has a great game, but team goals should always be above individual goals.
- Juice Boys: This concept goes back to the players who may not see the field as much. During the game, they may be lucky to get one or two plays on the defensive line. The “juice boys” is a concept used by Dan Mullen at Florida. The juice boys are the players that celebrate on the sideline and keep the team’s morale up. Much like the players at the end of the basketball bench, they may not play much but they are always the ones celebrating. I have thought about adding points for players that are “juice boys” that bring the juice to the game and always encourage other players. When we get a stop on third down or a turnover, they are the ones cheering the most. More than likely I’ll be adding this category in the future.
Conclusion:
To me, grading players based on performance is the way to go if you want to ensure healthy competition between units and extrinsically motivate players. I know it helped the cohesion of the defensive line as a unit and it made players have pride in their performance. In essence, it made them strive to play better and harder. Just like anything it had some negatives about it, but all in all I do think it played a small part in improving our defense.

0 comments on “Defense: The Importance of Defensive Performance Charts”